
Docker + docker-compose 설치
docker 설치 및 docker-compose 설치는 이미 설치했다고 가정한다. 만약 설치하지 않았다면 다음 url에서 설치 할 수 있다.
https://jung-mmmmin.tistory.com/124
[Docker] Docker 부터 docker compose 설치
실행환경 cat /etc/*-release | uniq DISTRIB_ID=Ubuntu DISTRIB_RELEASE=22.04 Docker 설치 sudo apt-get update 필요한 패키지 설치 sudo apt-get install apt-transport-https ca-certificates curl gnupg-agent software-properties-common Docker의 공
jung-mmmmin.tistory.com
Spring build.gradle 파일에 추가
dependencies{
    // monitoring
    implementation 'org.springframework.boot:spring-boot-starter-actuator'
    implementation 'io.micrometer:micrometer-registry-prometheus'
    ...

 }
application.yml파일 추가
management:
  endpoints:
    web:
      exposure:
        include: health, info, metrics, prometheus
  endpoint:
    metrics:
      tags:
        application:
          ${spring.application.name}
      enabled: true
    prometheus:
      enabled: true
global:
scrape_interval: 5s
scrape_configs:
- job_name : "yeti_api"
metrics_path: '/actuator/prometheus'
static_configs:
- targets: ['host.docker.internal:8080']localhost:8080/actuator/prometheus 호출해볼것

docker-compose.yml
version: '3.7'
services:
  prometheus:
    image: prom/prometheus
    container_name: prometheus
    volumes:
      - /[로컬경로]/prometheus.yml:/etc/prometheus/prometheus.yml
    ports:
      - 9090:9090
    command:
      - '--config.file=/etc/prometheus/prometheus.yml'
    restart: always
  grafana:
    image: grafana/grafana
    container_name: grafana
    ports:
      - 3000:3000
    volumes:
      - ./grafana/volume:/var/lib/grafana
    restart: always
    depends_on:
      - prometheus
    privileged: true
prometheus.yml
# my global config
global:
  scrape_interval: 15s # Set the scrape interval to every 15 seconds. Default is every 1 minute.
  evaluation_interval: 15s # Evaluate rules every 15 seconds. The default is every 1 minute.
  # scrape_timeout is set to the global default (10s).

# Alertmanager configuration
alerting:
  alertmanagers:
    - static_configs:
        - targets:
          # - alertmanager:9093

# Load rules once and periodically evaluate them according to the global 'evaluation_interval'.
rule_files:
  # - "first_rules.yml"
  # - "second_rules.yml"

# A scrape configuration containing exactly one endpoint to scrape:
# Here it's Prometheus itself.
scrape_configs:
  # The job name is added as a label `job=<job_name>` to any timeseries scraped from this config.
  - job_name: "prometheus"

    # metrics_path defaults to '/metrics'
    # scheme defaults to 'http'.

    static_configs:
      - targets: ["localhost:9090"]


  - job_name: "java_application"
    metrics_path: '/actuator/prometheus'
    scrape_interval: 5s
    static_configs:
      - targets: ["host.docker.internal:8080"]
docker-compose up을 통해 prometheus/Grafana 활성화
http://localhost:9090 접속
Status > Targets 메뉴로 이동해 나오면 정상 동작 중

http://localhost:3000/login 접속
초기 아이디/비밀번호 admin/admin

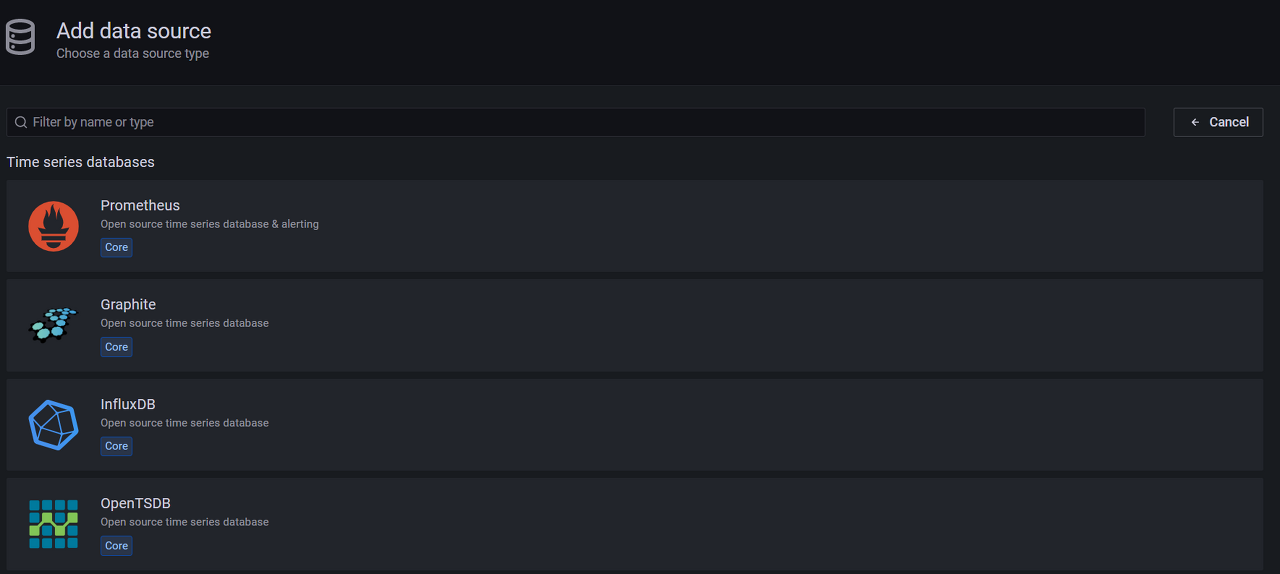
DATA SOURCES 클릭 > Prometheus > URL : host.docker.internal:8080 추가
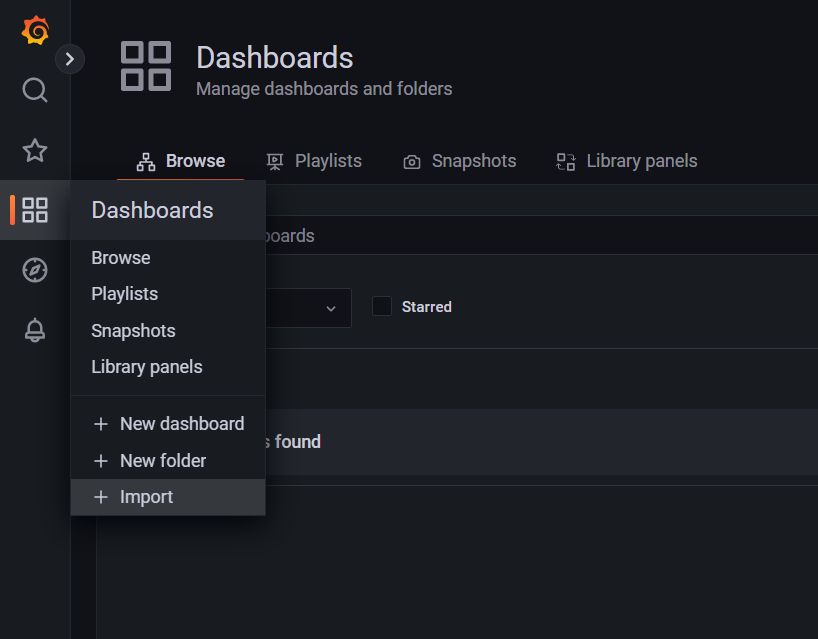
Dashboards > import > 4701 > Load

'DevOps' 카테고리의 다른 글
| [DevOps] CI/CD, Jenkins에 대한 개념이해하기 (6) | 2024.09.18 |
|---|---|
| [Mac/VMWare] Mac M1 VMWare Fusion 설치, CentOS 9 설치, Mariadb 설치 (0) | 2024.03.10 |
| nginx.conf 설정 (1) | 2024.01.09 |
| 맥북 영구 alias 등록하기 (0) | 2024.01.08 |


